Crosstown
Data visualization and digital design for a data journalism startup.
Overview
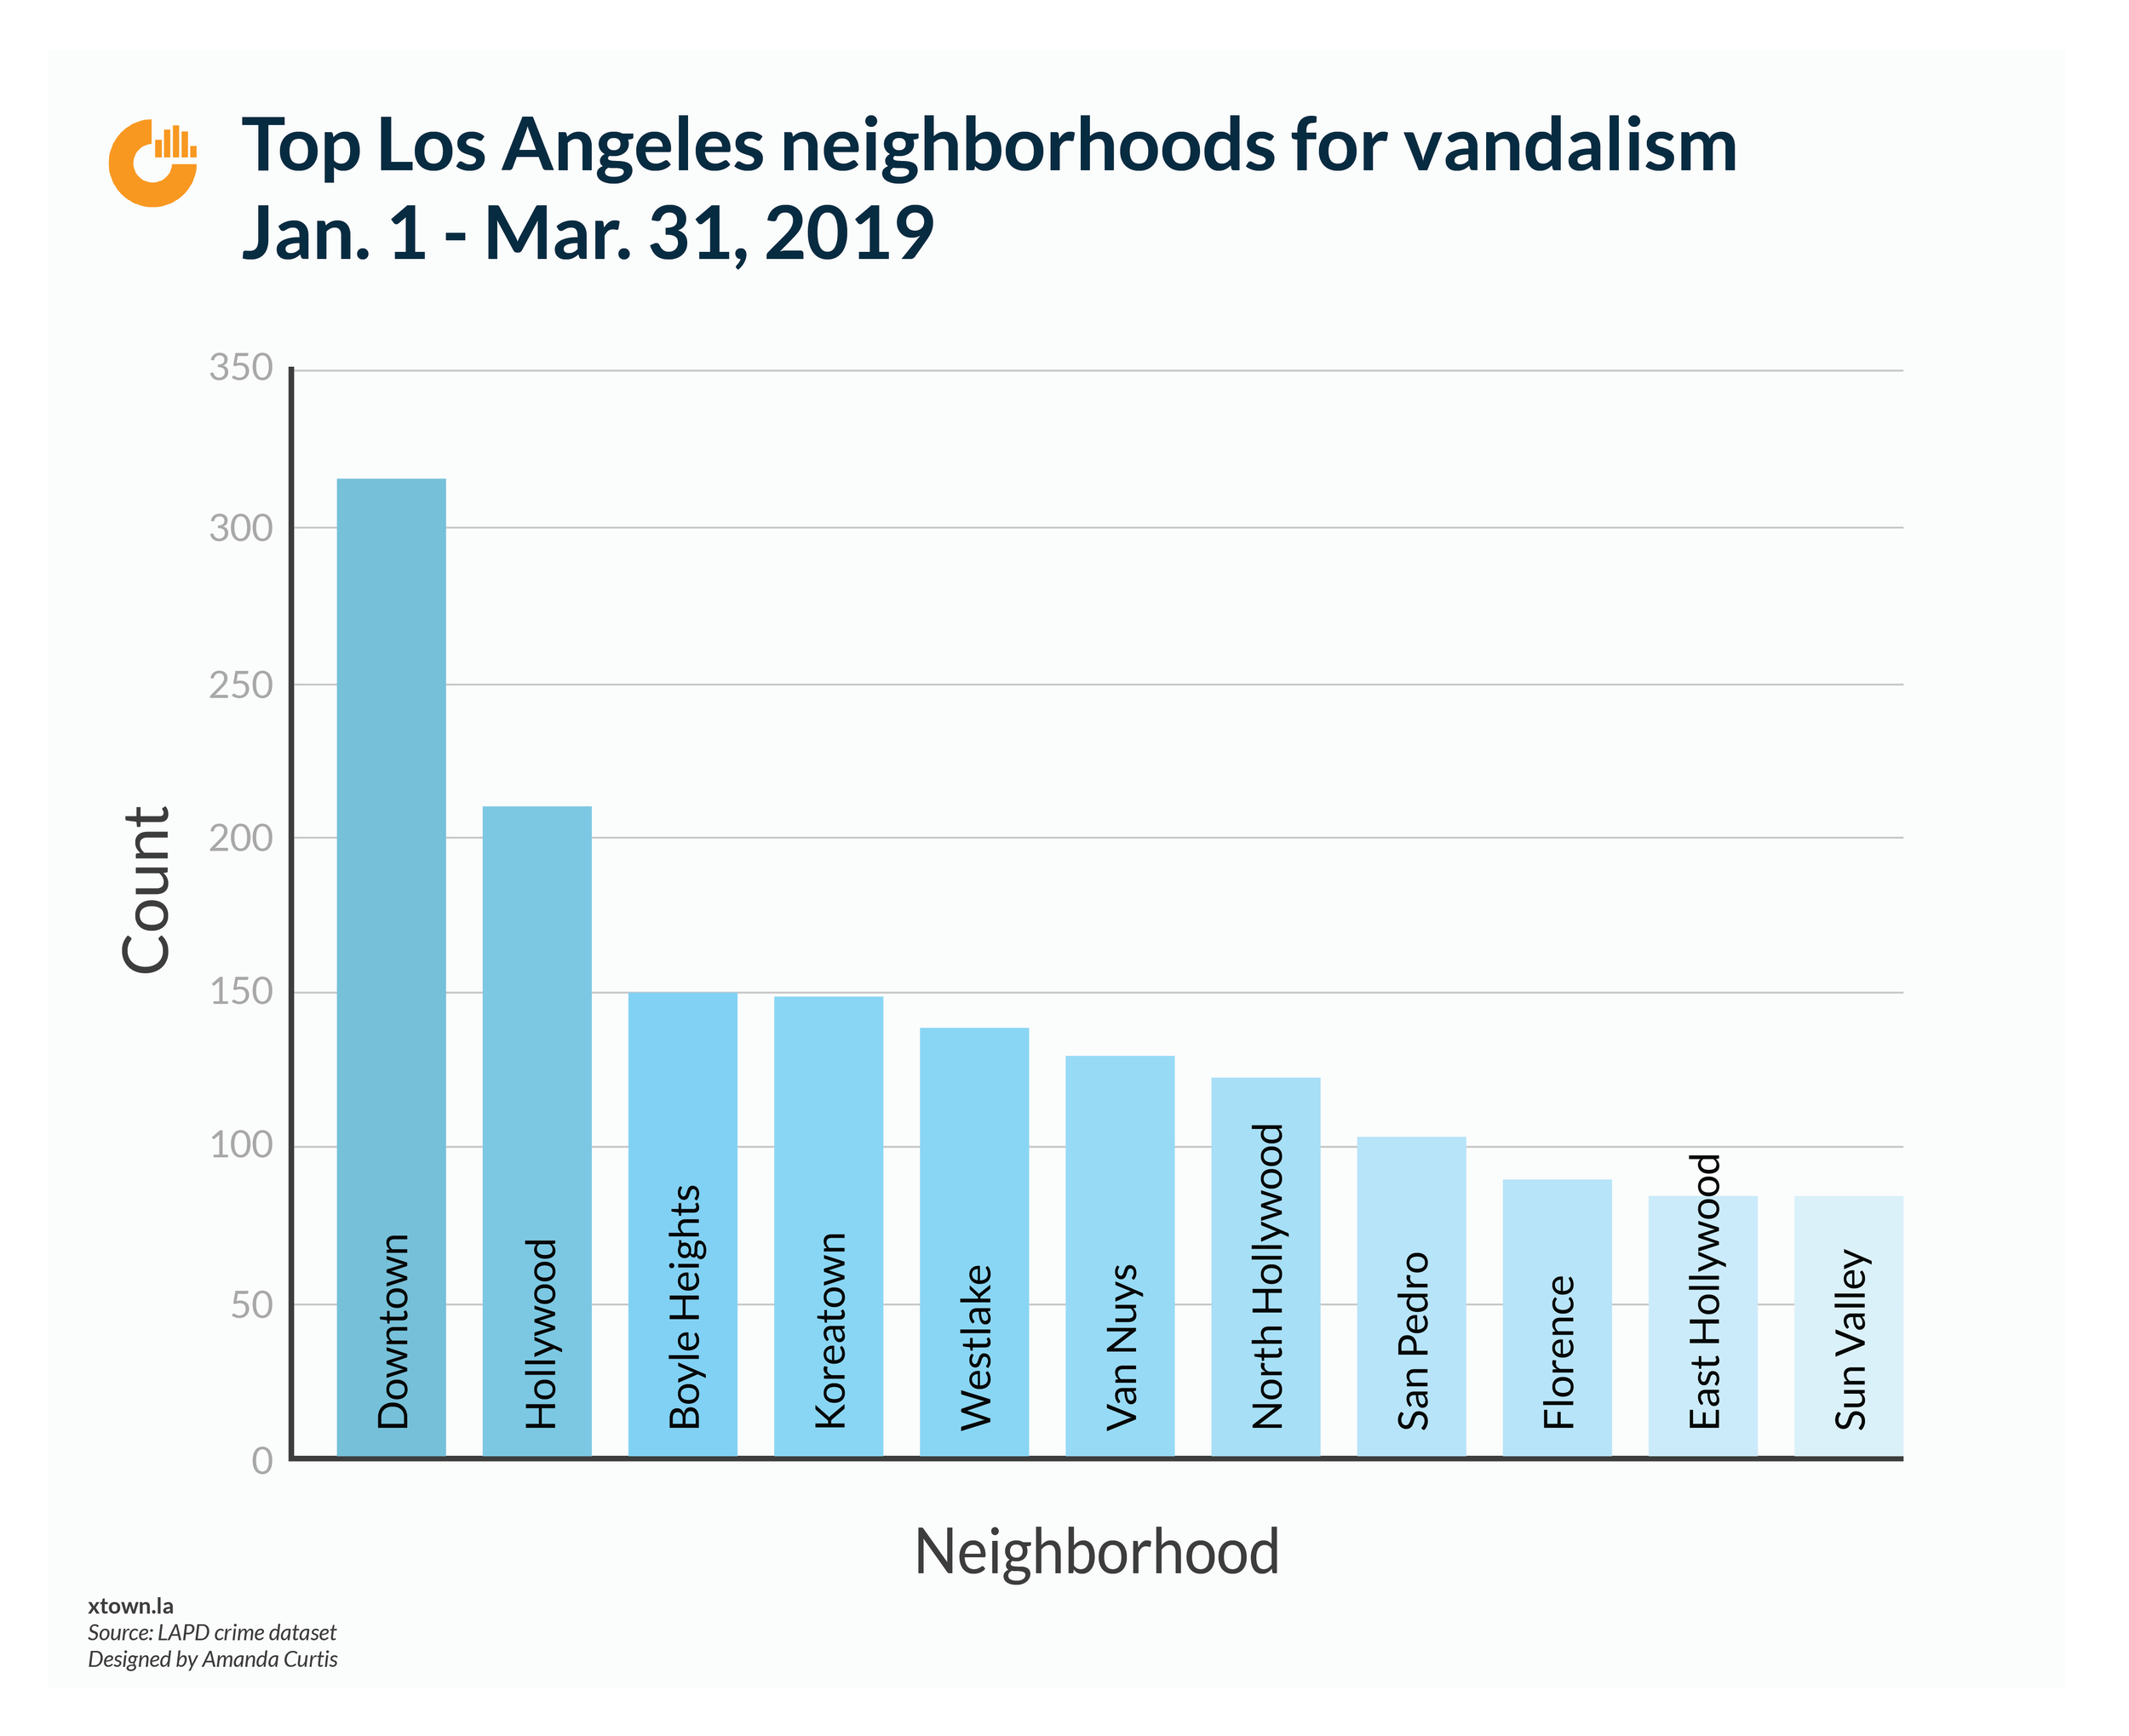
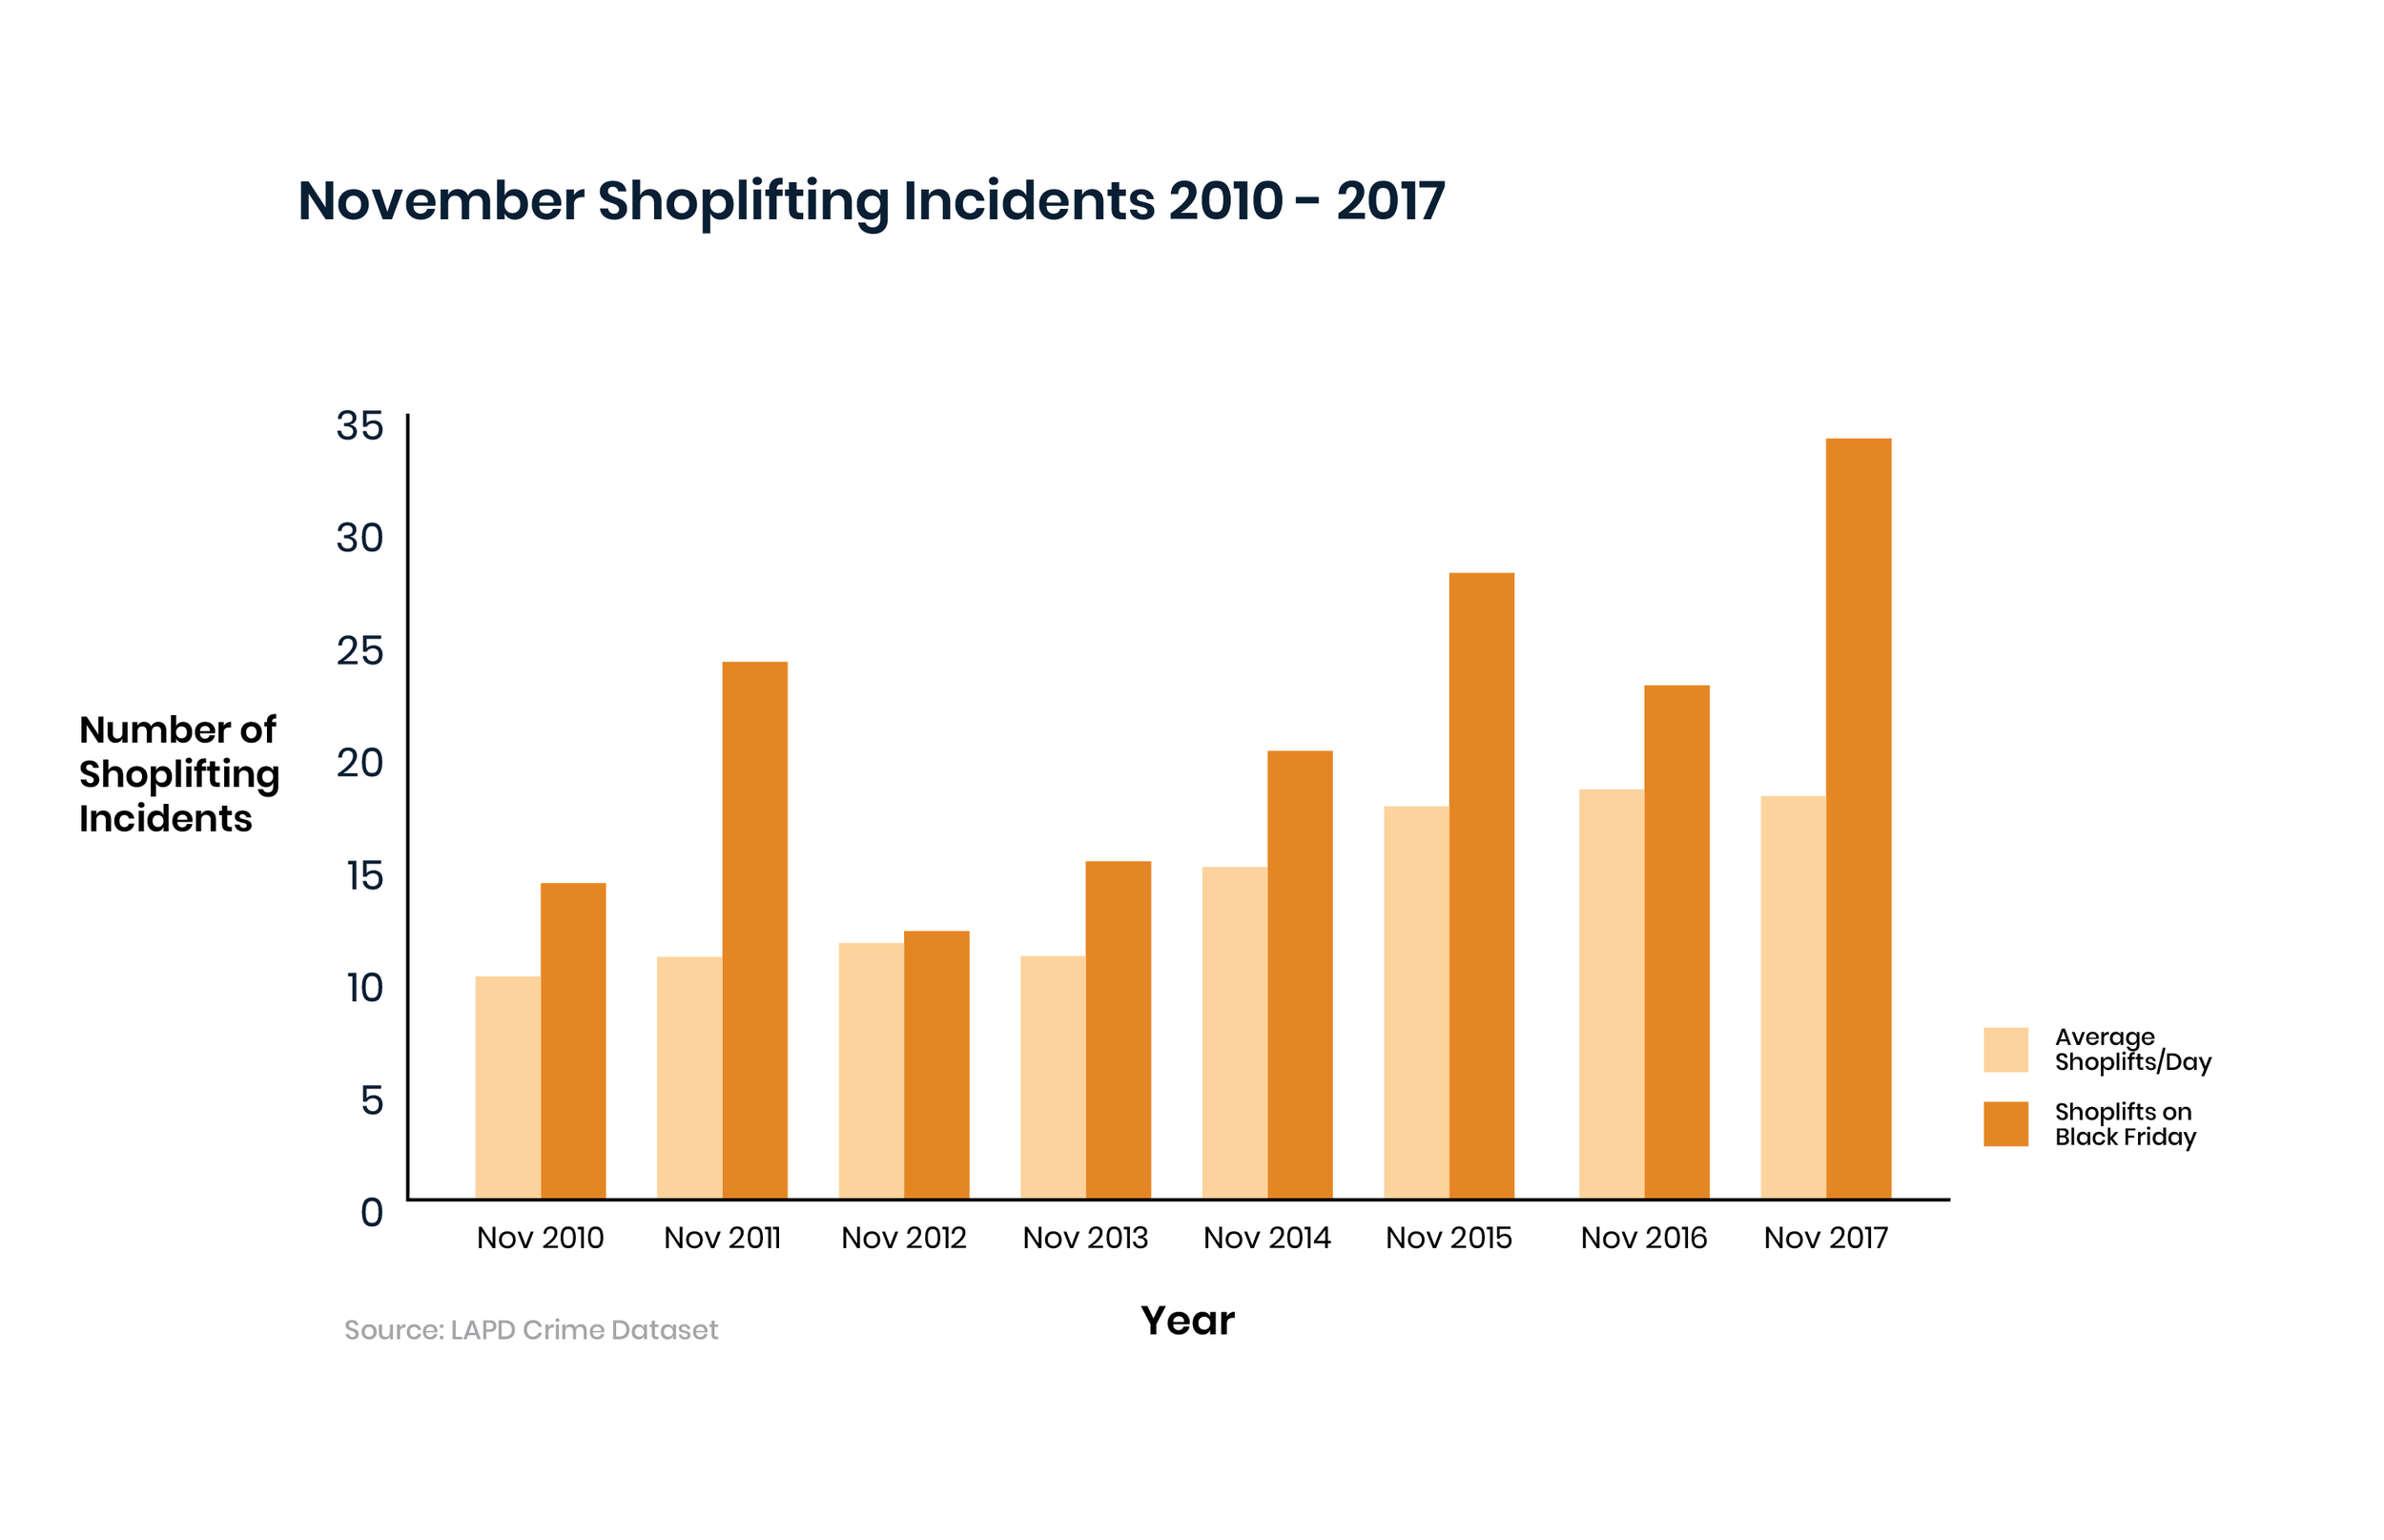
Crosstown is a data journalism startup based in LA that focuses on local, data-driven news stories. From May 2018 - September 2019, I worked as a data visualization designer, where I create a variety of infographics, visualizations, and illustrations to visually represent the data being reported on. I created designs both for Crosstown’s website as well as for social posts, including Facebook and Twitter. Additionally, I helped redesign the Crosstown website, developed a cohesive style-guide for all designers at the company to use, and ran a design sprint workshop for the team.
My role: data visualization designer.Focus: data viz, illustrations, web development.Tools: Illustrator, Photoshop, WordPress, R. 


